PUE and Carbon: How to (Truly) Measure Your Data Center’s Environmental Footprint in
PUE (Power Usage Effectiveness, energy efficiency) is the most cited metric in data center sustainability. It is also the worst measure. The difference between the PUE reported in a corporate brochure and the actual PUE measured at hourly intervals during the previous twelve months is usually what separates a serious conversation from a marketing pitch. This article describes how to measure PUE in a defensible manner, how to convert that measurement into a carbon footprint, and why the regional Mexican grid emission factor changes the result significantly.
What PUE measures and what it does not
PUE is defined as the ratio between the total energy entering the site and the energy that reaches the information technology equipment (servers, storage, network). When the PUE is 1.0, all the site’s energy is delivered to the useful load. When it is 2.0, for every watt that reaches the server, another watt is consumed in auxiliary infrastructure (cooling, UPS, distribution, lighting).
PUE does not capture the internal efficiency of the IT equipment (this metric has other names, such as SPUE or similar). Nor does it capture the impact of water, the manufacturing footprint of the equipment, or the embodied energy in the construction of the building. It is an operational metric, not a life cycle one.
Why instantaneous PUE is not useful
A well-designed modern site registers a PUE between 1.3 and 1.5 under favorable conditions: temperate climate, high load, and cooling system operating near its optimal point. But that number does not represent the site throughout the entire year:
- In July and August, with high outdoor temperatures in Querétaro, Monterrey, and Guadalajara, the PUE rises because the mechanical system works harder.
- During low load hours (night, weekends), the PUE rises because the fixed auxiliary energy weighs proportionally more.
- During scheduled maintenance, some subsystems operate in degraded mode and the PUE temporarily suffers.
Reporting only the PUE of the best month is technically correct but commercially misleading. The useful metric to evaluate real energy efficiency is the annual average PUE and the PUE of the worst month, both calculated with the same methodology.
Useful measurement methodology
For a PUE to be comparable and defensible, the measurement must meet five conditions:
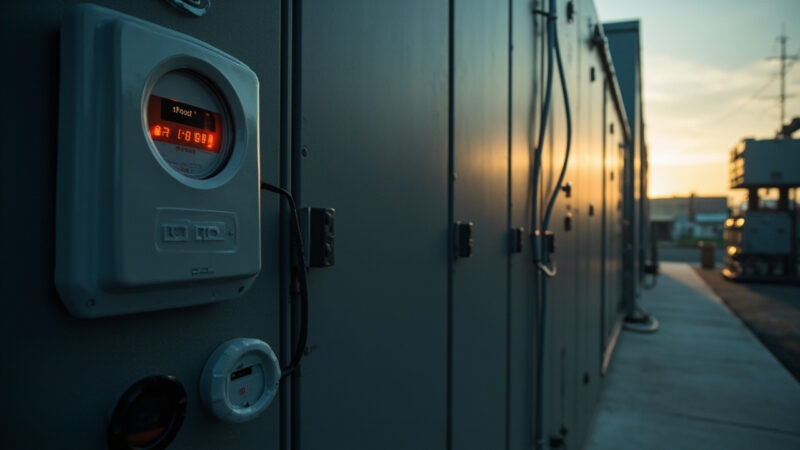
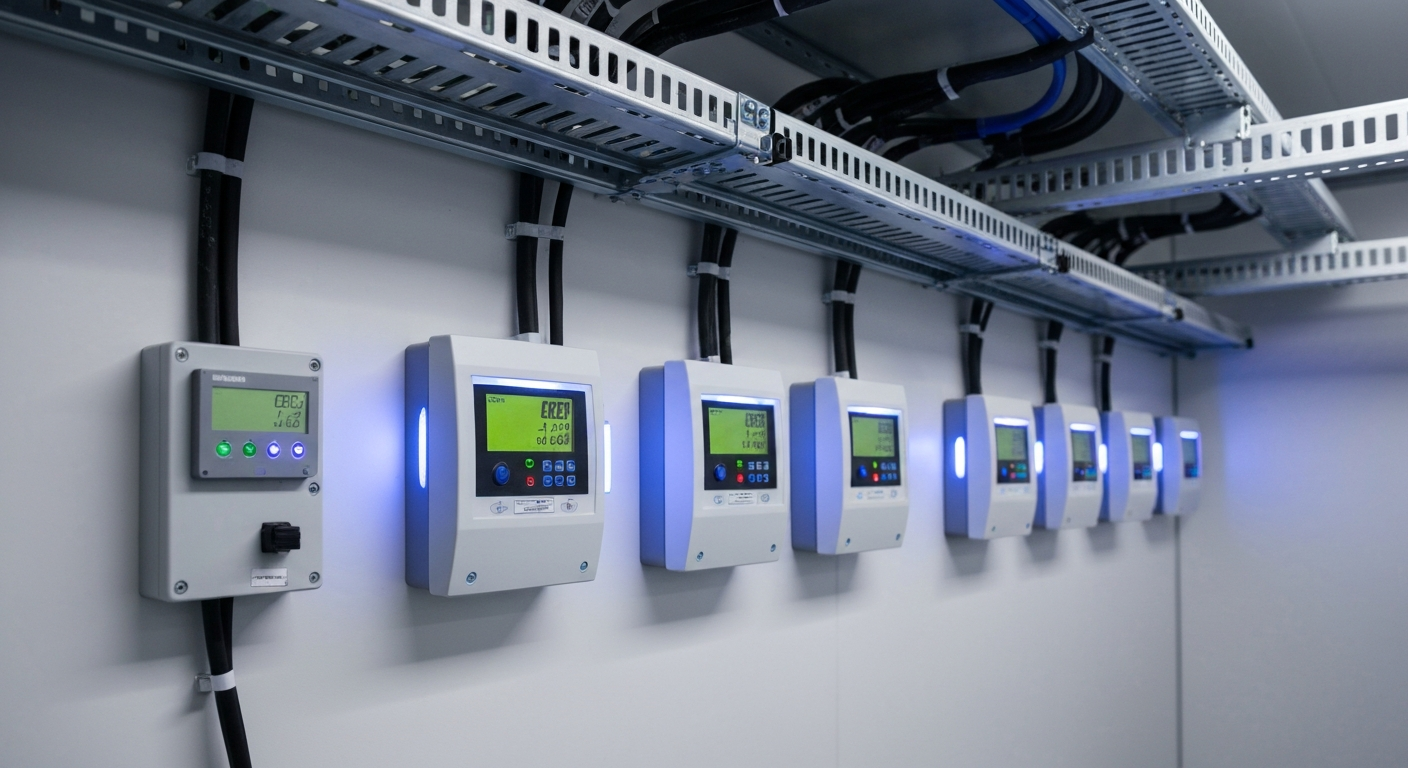
- Simultaneous measurement at least at two points: the main utility feed of the site (total energy) and the distribution busbar that feeds the IT load.
- Minimum hourly frequency, ideally sub-hourly, during a continuous period of at least twelve months.
- Documented calibration of the meters with traceability to national standards.
- Monthly reconciliation with CFE billing to detect deviations between what is measured and what is billed.
- Publication of the worst month, not just the average, because that is where the real capacity of the mechanical system is shown.
The conversion to carbon footprint
Once the actual electrical consumption of the site is obtained, the conversion to carbon footprint requires an emission factor. The factor expresses how much CO₂ equivalent is emitted for each kilowatt-hour consumed, and depends on the generation mix that feeds that consumption at that time and place.
The emission factor of the Mexican National Interconnected System (SIN) is not unique. It varies by:
- Region of the country: the Bajío, the north, and the Yucatán peninsula have different generation compositions.
- Time of day and season of the year: the share of solar and wind renewables varies significantly between midday and night, and between summer and winter.
- Year: the aggregate factor of the SIN has historically changed as more renewables are incorporated and fuel oil plants are retired.
CFE publishes operational information on generation dispatch that allows estimating the regional and hourly factor. The most precise methodology uses an hourly factor (a different value for each hour of the year), not an annual average.
Why Querétaro and Monterrey are not equivalent
Although both states belong to the SIN, the generation mix that feeds each region has structural differences that are reflected in the emission factor:
- Regions with greater penetration of intermittent renewable generation (solar in the north and Bajío, wind in the Isthmus and south) have a more variable hourly factor: low at midday, higher during nighttime hours.
- Regions with greater dispatch of combined cycles and conventional thermoelectric plants have a more stable but generally higher average factor.
- Altitude affects the efficiency of some generation equipment and, therefore, the calculated emission factor per unit of energy delivered.
For a site in commercial operation, the practical implication is direct: two sites with the same PUE and the same annual consumption can have materially different carbon footprints depending on their location within the SIN.
Reports that you can actually defend before a CFO or an enterprise client
When an enterprise client or an auditor asks for evidence of sustainability, there are three documents that the data center must be able to deliver without improvising:
- PUE report with measurement methodology, frequency, temporal coverage, and worst month included.
- Carbon footprint calculation with a documented emission factor traceable to the regulatory source.
- Improvement plan with quarterly or annual goals, assigned responsible parties, and measurable progress.
A report that omits any of these three elements does not survive an external audit or a due diligence from an enterprise client. The investment in continuous measurement pays for itself in the first sustainability review cycle.
Sources
[1] Uptime Institute — Global Data Center Research and Reports: https://uptimeinstitute.com/resources/
[2] ASHRAE — Technical Resources for Data Center Thermal Management: https://www.ashrae.org/technical-resources
[3] Lawrence Berkeley National Laboratory — Data Center Efficiency Research: https://datacenters.lbl.gov/
[4] CFE — Operational data of the national electrical system: https://www.cfe.gob.mx/
[5] IEA — Data Centres and Data Transmission Networks: https://www.iea.org/energy-system/digitalisation/data-centres-and-data-transmission-networks
[6] Wikipedia — Power usage effectiveness: https://en.wikipedia.org/wiki/Power_usage_effectiveness
[7] Wikipedia — Carbon footprint: https://en.wikipedia.org/wiki/Carbon_footprint
[8] Wikipedia — Data center: https://en.wikipedia.org/wiki/Data_center
Want to master this?
Noxtel Academy →