Green data center for AI: what changes in your room when you train LLMs
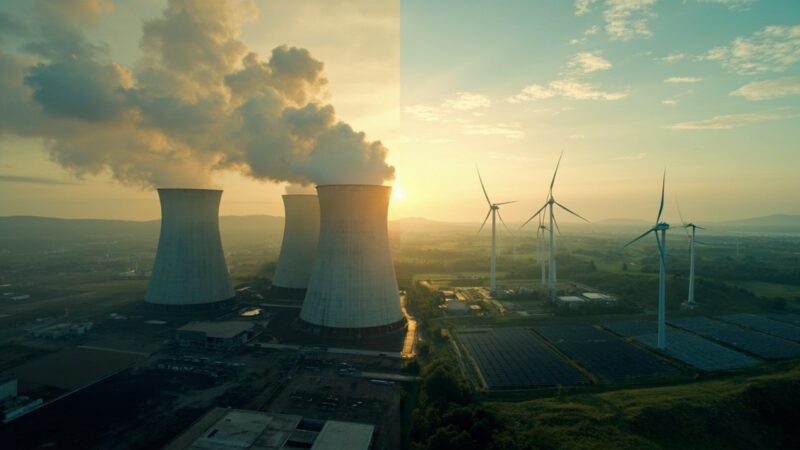
The conversation about green data centers shifted in nature in 2024. Until recently it was a corporate marketing argument; today it is a technical decision with direct consequences on the electrical, mechanical, and financial design of the site. Training and serving AI models consumes electricity at a density and variability that traditional data centers were not designed to handle, and at the same time ESG (Environmental, Social, and Governance) and regulatory commitments push to reduce the carbon footprint.
This article describes what changes operationally when a data center is oriented to AI workloads, which technical parameters are affected, and which design decisions are worth taking from the conceptual phase so the site does not become obsolete before it is energized.
How the load profile changes moving from traditional to AI
A site oriented to traditional workloads (web, databases, mail) has a relatively predictable load profile: daytime variations of 20–30% over the average. A model-training site has a radically different profile:
- Per-rack power can move from 8–12 kW (traditional site) to 60–100 kW (large-model training) according to the hardware specifications of vendors like NVIDIA with its DGX line.
- Consumption peaks are simultaneous and short-lived, but they require the electrical system, cooling, and distribution network to be sized to support them without throttling (the automatic reduction in speed to prevent overheating).
- The heat generated is far more concentrated per unit of volume, which forces the mechanical system to be rethought from the design stage.
These three changes are not incremental. They upend the electrical and mechanical design baselines used for traditional sites.
What the IEA says about sector electricity consumption
The International Energy Agency (IEA) publishes periodic analyses on the aggregate electricity consumption of the data-center sector and its growth tied to AI deployment. The figures vary by base year and methodology, but the directional trend is consistent: the sector’s electricity consumption is growing at rates above the average for total electricity demand, and the share attributable to AI workloads is rising within that total.
For a specific site in Mexico, what matters is not the global figure but two concrete questions:
- What is the carbon-emission factor of the electric grid feeding my site? In Mexico that factor depends on the generation mix that CFE (Comisión Federal de Electricidad) dispatches at any given moment and varies by region.
- How can I measure and report the real electricity consumption of my AI workload, separated from the auxiliary infrastructure consumption (cooling, lighting, UPS losses)? The answer is to measure the PUE (Power Usage Effectiveness) continuously and representatively.
The ASHRAE guidelines and why they widened the operating range
ASHRAE (American Society of Heating, Refrigerating and Air-Conditioning Engineers) published in its technical guidelines (the TC 9.9 family on data-processing environments) recommendations that widened the accepted range of temperature and humidity for IT equipment operation, based on empirical evidence that modern hardware tolerates broader conditions than the classic recommendations. The practical implication is direct:
- A well-designed site can operate in a wider range without compromising equipment availability.
- That tolerance allows more aggressive free cooling (use of outside air to reduce mechanical load) strategies in temperate climates, and cuts mechanical-system electricity consumption during the warmer months.
- The decision to operate in the widened range must be documented and backed with data from the specific equipment manufacturer, not assumed as universal.
On-site solar panels: when they complement vs substitute the grid
The decision to install solar panels or distributed generation at a data center depends on three variables that must be evaluated case by case:
- The available solar irradiance at the location. Mexico has clear competitive advantages in regions like the Bajío and the north, with high annual averages compared to other latitudes.
- The available area on the roof, ground, or adjacent land. Not every site has the physical space for the panel scale that would meaningfully offset consumption.
- The distributed-generation regulatory scheme and the interconnection times with the CFE grid, which in some regions are long and affect the financial viability of the project.
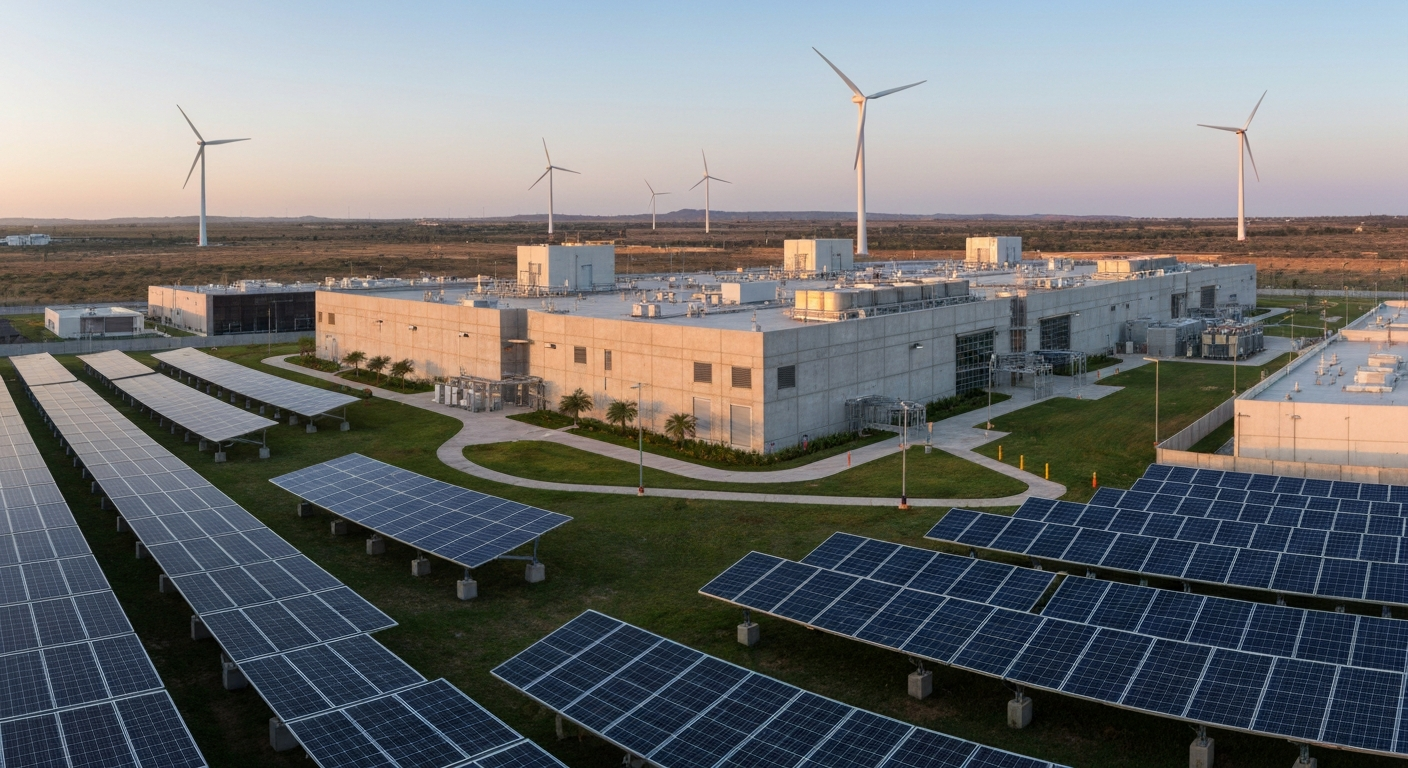
An honest evaluation avoids overselling the renewable solution. For most sites in Mexico, on-site generation complements but does not substitute the grid; full renewable coverage usually requires power purchase agreements (PPAs) with the grid.
PUE: the most cited and worst-measured metric in the sector
PUE is the most cited and worst-measured metric in the sector. Three common errors distort the result and compromise any reduction plan:
- Measuring instantaneous PUE at a favorable moment (mild weather and high load) and presenting that number as representative of the site.
- Excluding UPS (Uninterruptible Power Supply) losses, transformers, and auxiliary cooling from the calculation.
- Not reporting monthly and annual variability, which is where the real mechanical-design problems show up.
The metric that is useful for sustainability and operational-efficiency purposes is the annual average PUE measured at hourly intervals over the past twelve months, accompanied by the worst month and the measurement methodology. Without that information, any “green data center” claim should be read with caution.
Five technical decisions for an AI-ready site
Five technical decisions separate an AI-ready site from one that will be trapped in a costly redesign:
- Size the electrical and mechanical system for the highest per-rack density scenario expected at 36 months, not for day-one.
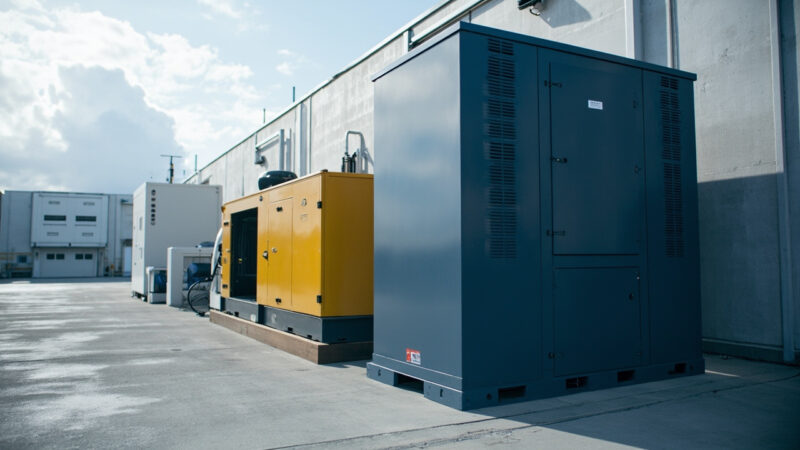
- Select a cooling architecture that allows a gradual migration from air to liquid without rebuilding the site.
- Install energy-measurement instrumentation per rack or per row, not only aggregated measurement at the site level.
- Negotiate with CFE a tariff and supply-quality scheme that reflects the real consumption profile, especially if the site is in a variable-area zone.
- Document the regional grid emission factor so the carbon footprint can be reported defensibly to clients and regulators.
These are the decisions that differentiate an AI site built as critical infrastructure from one built as a marketing project. The operational and financial consequences show up in the first 24 months.
Sources
[1] IEA — Data Centres and Data Transmission Networks: https://www.iea.org/energy-system/digitalisation/data-centres-and-data-transmission-networks
[2] ASHRAE — Technical Resources for Data Center Thermal Management: https://www.ashrae.org/technical-resources
[3] NVIDIA — DGX Systems Specifications: https://www.nvidia.com/en-us/data-center/dgx-systems/
[4] Lawrence Berkeley National Laboratory — Data Center Research: https://datacenters.lbl.gov/
[5] CFE — Open data on generation and consumption: https://www.cfe.mx/
[6] Wikipedia — Power usage effectiveness: https://en.wikipedia.org/wiki/Power_usage_effectiveness
[7] Wikipedia — Hyperscale computing: https://en.wikipedia.org/wiki/Hyperscale_computing
[8] Wikipedia — Data center: https://en.wikipedia.org/wiki/Data_center
Want to master this?
Noxtel Academy →